The Key to Winning Consistently - By David Bendeich
Thankfully most of the systems have proved themselves.
The UniTAB systems have been ultra consistent, resulting in a red letter day 21 September 2007 where there were 3 bets (two in one race) for two winners at the best tote prices of $7 and $11.80.
The Geoff suite of systems has been good without being spectacular. One of the systems has been performing poorly, so I started to look for the weakness and found it. Of course when I found the trend it looked deceptively simple but there needs to be patience with these things because they are not always obvious. The new rules for the system have been sent to purchasers of the book.
With all these selections now having a bit of history, Winform used Money Factory software to determine if the profitability could be improved. This trial was run using all selections from the book from 1 May 2007 until 25 September 2007 and included the selections which I have now removed. The level stakes profit was 20% and Money Factory improved that to 39% profit using a bank of $4000.
And another thing. If you are recording data for a system, you need to know its long term ‘health’. Is it doing just as well as you first thought, are the form principles sound, or is the system in decline? If the principles are sound then a long term check will show that.
I did this check for the spreadsheet that I use for the Geoff selections. I looked at the first half of the spreadsheet and the second half and compared the results. This data is for all contenders, not just the systems I have developed.
Section |
No of selections |
No of winners |
Win Strike rate % |
Win Profit % |
No of places |
Place Strike rate % |
Place profit % |
First Half |
1693 |
489 |
28.8 |
(8.7) |
1095 |
64.7 |
(3.4) |
Second Half |
1693 |
460 |
27.2 |
(5.1) |
1020 |
60.2 |
(0.1) |
TOTAL |
3386 |
949 |
28.0 |
(6.9) |
2115 |
62.4 |
(1.7) |
Everything seems on track with the long term trend maintained. This split of the data occurred at the beginning of May 2007 and that is when the wet tracks become more prevalent and the higher priced winners appear. So the fact that the second half of the data show a lower strike rate and higher WPOT (27.2% and loss of 5.1%) compared with 28.8% and loss of 8.7% for the first section is normal given the racing conditions, the type of races and the competitors in those races.
Politics
The Australian Federal election is looming and when you read this the outcome might be known.
If you have heard of the expression that something is a sure bet, then this seems to be one of those cases. Political bets are good because the likely outcome can be gauged from reasonably reliable sources like the opinion polls, the letters to the editor of major newspapers, TV opinion shows, the betting market and because this is a head-to-head contest.
Like the Melbourne Cup and similar races, many try to forecast the likely result and get the best price on offer well before the event.
The major negative of these types of bets is that your money is in the pool for a long time, especially if you have bet very early.
So for a while I have been watching the markets on the Australian election and put some money on early. I think my bet is fairly assured because the market in late September says that the likely result is that Labor will win with a price now $1.40 in the ‘fixed’ markets. Of course other market forces may come into play and move this price.
Betfair is trading on this market and it is interesting to see how this market has moved.
This is quite similar to a horse race where the ‘market movers’ win more than their fair share of races. Here the price for Labor has firmed since the market started trading as displayed in the following screen shot.
Figure 1 Labor price on Betfair
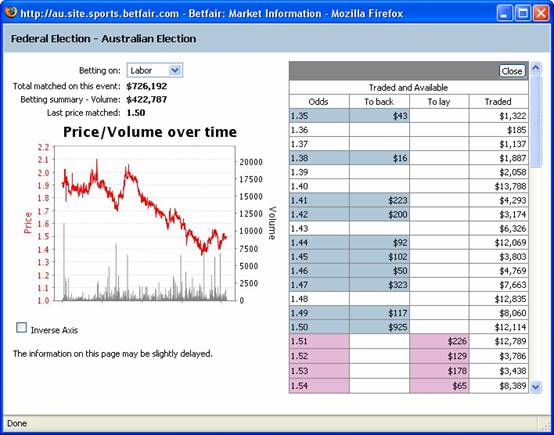
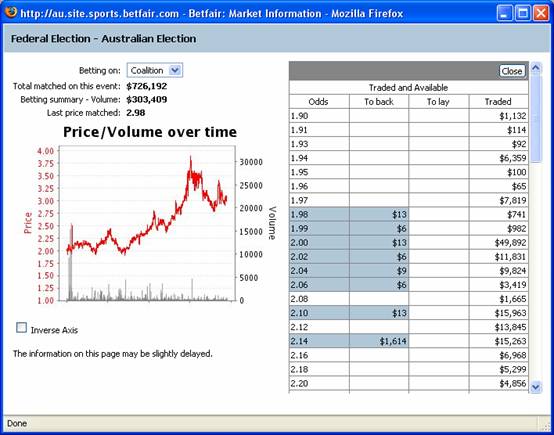
Figure 2 Coalition price on Betfair
Equine Influenza
The effect of the lack of racing and interrupted preparations of horses due to the equine influenza outbreak can be measured. Each race meeting where a series of races is conducted with only horses trained on the track has thrown up some more inconsistent results than is normally the case.
The following two pictures show the results for a group of systems I use. The first picture is for August 2007 and the second picture is for September 2007. I don’t think that these results are unexpected.
Although I was on holidays at the time of the outbreak and the cessation of racing (25 August 2007) I was aware what had happened because I was monitoring some of the systems I use each day. My first response was to consider the impact to the people involved in the industry and secondly the impact on the economy of the nation.
My other thought was ‘What are the tens of thousands of people who are involved in Saturday racing going to do when the first meetings were cancelled?’ What did you do? I am sure that there was a sense of loss by some and others found some equally useful (or better?) activity.
GTX System Developer
In the previous issue of Horse Racing Australia magazine, Tegan Lloyd wrote an article about the various aspects of the GTX system developer.
She used this to develop the systems which are the UniTAB section of my book ‘The Key to Winning Consistently’.
There is a chart available in this tool and here are some of the results from the systems she developed.
This use of this chart is invaluable because it tells you at a glance if what you are developing has the right profit trend line.
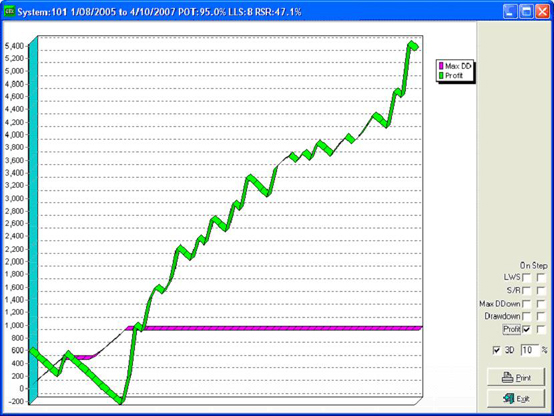
Above: © 2007. These images are from the GTX Program
This picture shows what can be developed on the GTX system developer. This chart is for a group of systems which I developed and although the results on the system developer show a small profit, the chart clearly shows that for most of the period analysed the systems were losing money.
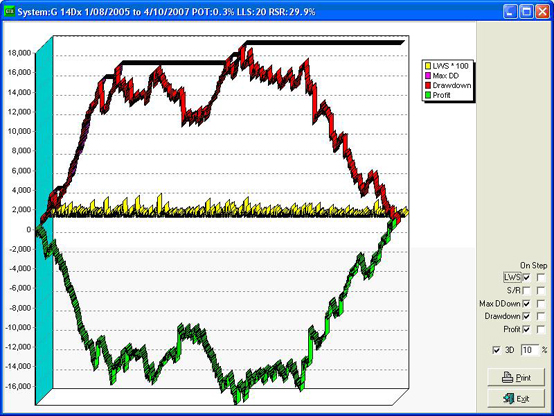
This time a very good map resulted! This shows that there is a lot of work to do to improve the long term profitability of this group of systems by removing southern Western Australia, the Great Australian Bight, South Australia, Victoria and most of New South Wales from the profit line. This is a situation where Tasmania is correctly left off the map.